
All data for this account is guaranteed by the website
Share to ...
Copy Link
The Night Lexicon******exicon | 91.1K followers instagram account
United States, 72% men, 6 months aged
@******exicon

Posts
591

Followers
91.1K
Following
13


Date of Joined
Sep 2025

Date of First Post
Oct 1, 2025

Date of Last Post
Feb 20, 2026
All (Last 3 Months)

7.9M
141.4M
25.7K
1M
444K
Averages
88.2K
1.5M
286
11.9K
4.9K
Engagement over time
Likes
Comments
Video to photo ratio
Pictures
Videos
Post/Per Month
Besties

Most Liked
447.8K
Most Commented
1.2K
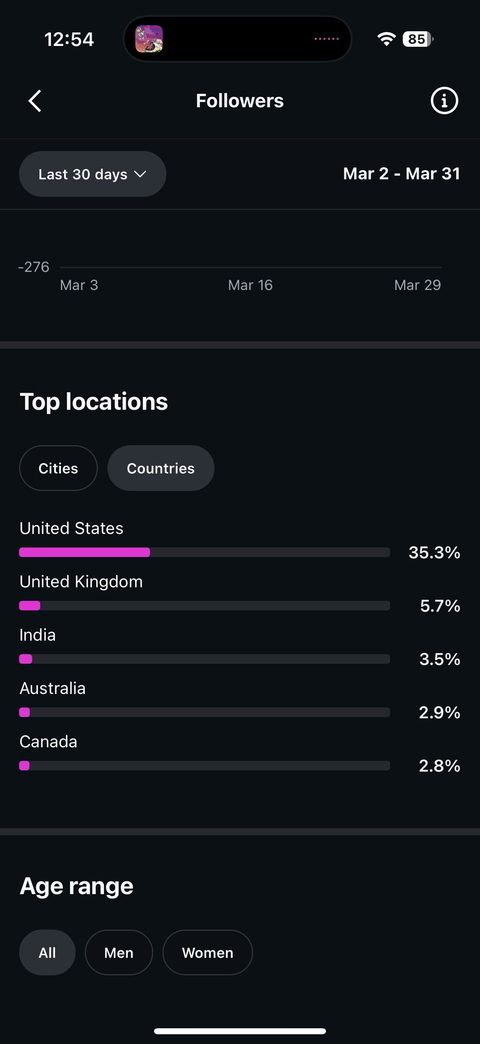
Top Countries
United States
40.7%
United Kingdom
6.6%
India
4.1%
Australia
3.3%
Canada
3.2%
Iran
2.7%
Germany
2.5%
South Africa
2.4%
Mexico
2.0%
Brazil
2.0%
Top Cities
New York New York
8.5%
Semnan Semnan Province
5.5%
Los Angeles California
4.8%
London England
4.4%
Sydney New South Wales
4.1%
Melbourne Victoria
3.9%
Nairobi Nairobi
3.8%
Dar Es Salaam Dar Es Salaam
3.1%
Cape Town Western Cape
3.0%
Chicago Illinois
2.9%
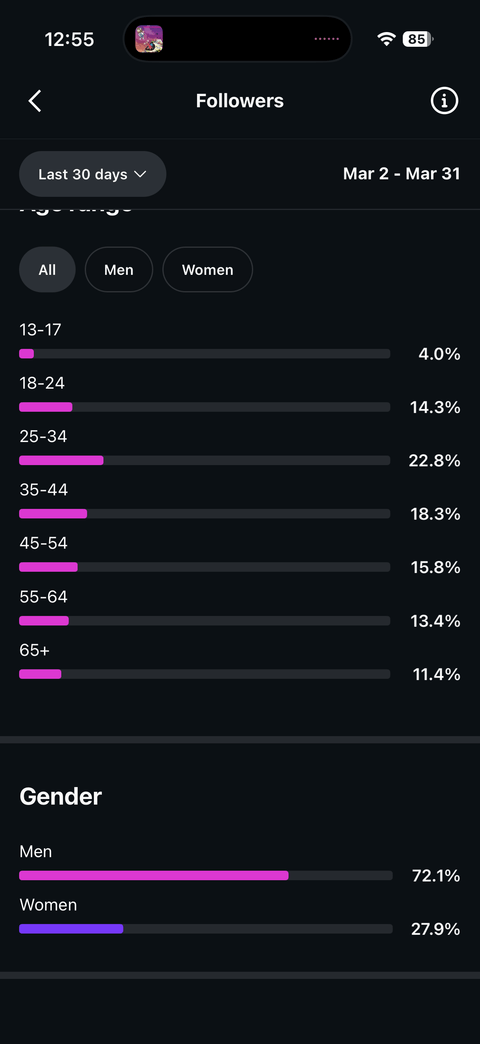
Gender
Male
56.0%
Unknown
22.4%
Female
21.6%
Age range
25 34
22.7%
35 44
17.7%
45 54
15.3%
18 24
15.1%
55 64
13.1%
65
11.6%
13 17
4.4%
Top 10 Hashtags
replies
Total Value
4
accounts engaged
Total Value
7.3M
Performance by Media Type
View how your account performs across different types of Instagram content — such as Reels, Stories, and Feed posts. This breakdown helps you understand which media formats drive the most engagement and reach, so you can focus your efforts on the most effective content types.
Total Interactions
Reel
100.0%
10.7M
Post
0.0%
35
Story
0.0%
5
Likes
Total
7.9M
Reel
100.0%
7.9M
Post
0.0%
19
Views
Total
141.4M
Ad
0.0%
441
Story
0.0%
11.1K
0.0%
16
Reel
100.0%
141.4M
Carousel Container
0.0%
1.2K
Comments
Total
25.7K
Reel
100.0%
25.7K
Shares
Total
1M
Post
0.0%
6
Reel
100.0%
1M
Saves
Total
444K
Reel
100.0%
444K
Post
0.0%
4
Reach
Total
71M
Ad
0.0%
240
0.0%
34
Reel
100.0%
71M
Story
0.0%
3.4K
Carousel Container
0.0%
1.4K
Follower vs Non-Follower Engagement
Displays how this metric differs between followers and non-followers, allowing you to identify which audience group contributes more. Use this insight to evaluate reach, interest, and overall engagement across different audience segments.
Views
Total
141.4M
Non Follower
98.9%
139.8M
Follower
1.1%
1.5M
Unknown
0.0%
30.6K
Reach
Total
71M
Non Follower
99.9%
71M
Follower
0.1%
47.9K
Non Follower
100%
Follower
0%
Account Reach Over Time
Track how many unique accounts have seen your content over time. This metric shows your overall visibility and audience growth, helping you identify trends, peak performance days, and the impact of your recent posts or campaigns.
reach
- Total
- 92.2M
- Average
- 1M
- Peak
- 4.6M
- Last 7 Days Avg
- 143.2K
Description
No Data
Upload Insight
Last Posts

447.8K
1.2K

29.7K
258

17.8K
59

4.5K
12

2.5K
18

2.3K
17

2K
13

1.8K
26

1.7K
6

1.6K
15

1.6K
7

1.4K
23

1.4K
20

1.3K
9

1.3K
19

1.2K
3

1.2K
2

1.1K
0

1.1K
4

1.1K
33

1.1K
4

1K
1

1K
4

948
32

873
53

819
6

796
10

757
5

706
7

690
21

632
6

608
1

570
10

557
8

534
0

507
0

465
6

460
7

452
7

444
6

436
14

433
7

429
5

413
4

343
5

289
0

200
2

184
0

173
8

143
0

Listing Statistics
18
2 days ago
SeBuDA
Recently our headquarters moved from USA to Netherland so we could make more features for our users, we sure that our users can feel the changes in the future and this decision is for sake of our users
Netherland
Sebuda B.V.
CoC Number: 95490469
Zuid-Hollandlaan 7, 2596AL ‘s-Gravenhage
The Hauge, The Netherlands
(+31)0687365374
Be with us on Social Networks
Social media accounts for sale
Help and Services
© 2022 SeBuDA.com, All rights reserved.